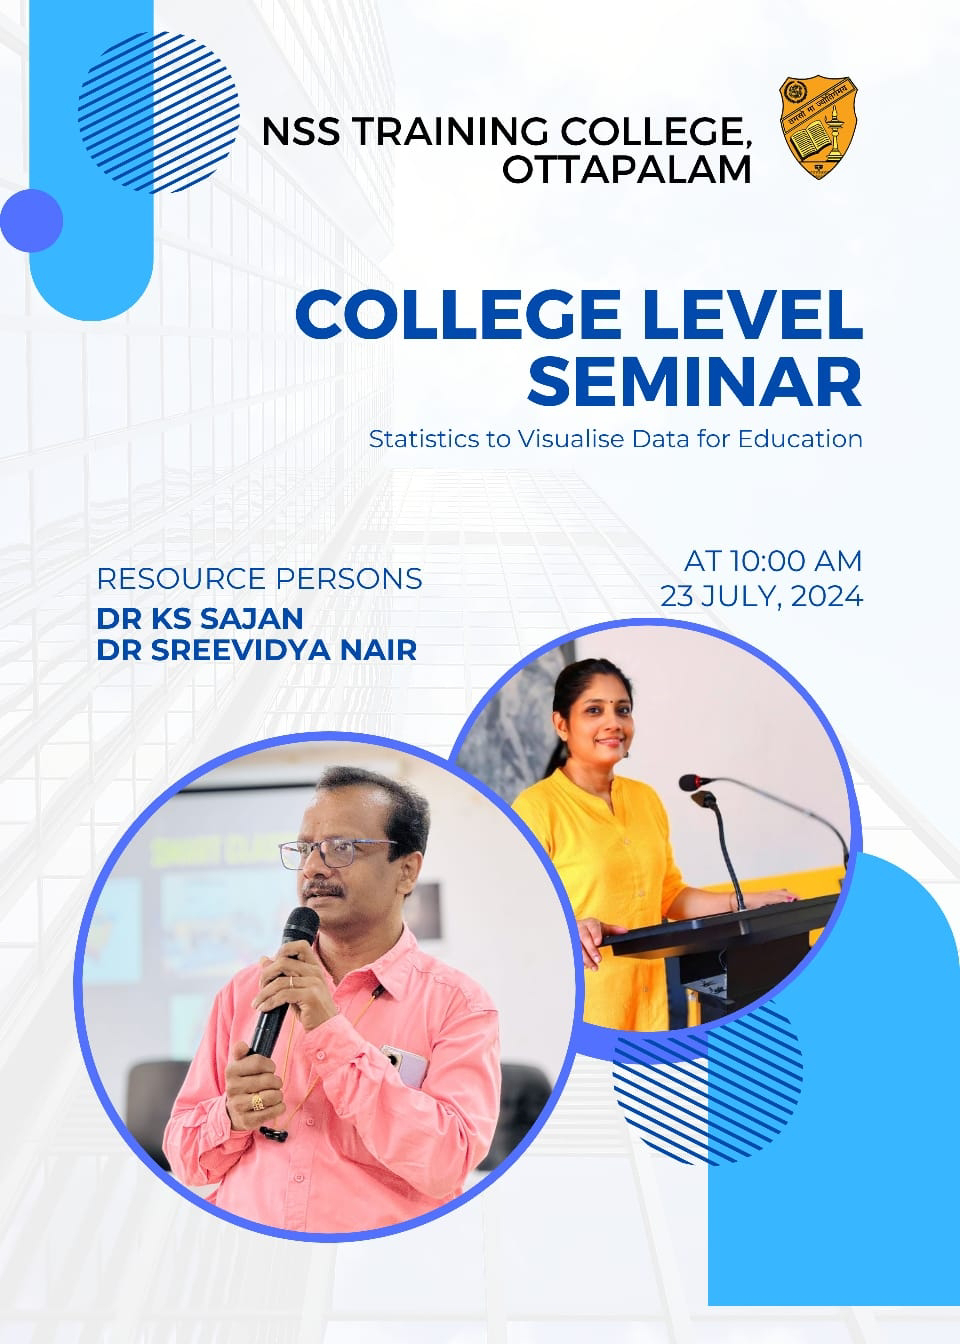
Report on College-Level Seminar: "Statistics to Visualize Data for Education"
Event Details
● Title: Statistics to Visualize Data for Education
● Date: 23rd July 2024
● Venue: College Auditorium, NSS Training College Ottapalam
Introduction
NSS Training College Ottapalam organized an insightful seminar titled "Statistics to Visualize Data for Education" on 23rd July 2024. The event aimed to enhance the understanding of basic statistical tools and data visualization techniques among undergraduate students. The seminar featured two esteemed resource persons, Dr. K. S. Sajan and Dr. Sree Vidya Nair N., who brought their extensive expertise in the field of statistics and data analysis to the attendees.
Resource Persons
● Dr. K. S. Sajan: Renowned for his contributions to statistical research and education, Dr. Sajan has vast experience in applying statistical methods to educational data. His sessions demonstrated various basic tools used for statistical analysis and data visualization in education.
● Dr. Sreevidya Nair N.: An expert in data visualization and educational analytics, Dr. Sreevidya explained the functions of different statistical tools and their importance in deriving meaningful insights from educational data.
Seminar Highlights
1. Welcome Address: The seminar commenced with a welcome address by one of the students, who highlighted the importance of statistics in modern education and the relevance of the seminar's topic for undergraduate students.
2. Session by Dr. K. S. Sajan: Dr. Sajan began his session by demonstrating different types of basic statistical tools used in analysis and visualization. He showcased tools such as measures of central tendency (mean, median, mode), measures of dispersion (range, variance, standard deviation), and correlation. His engaging presentation included practical demonstrations, making it easier for participants to understand how to use these tools effectively.
3. Session by Dr. Sreevidya Nair N.: Dr. Sreevidya’ s session focused on explaining the functions of different basic statistical tools and their applications in educational settings. She covered topics such as descriptive statistics and correlation, illustrating how each tool can be used to analyze and interpret educational data. She explained the uses of different graphs too.Her clear and concise explanations helped the students grasp the significance of each tool in visualizing data for education.
4. Graphical Representations: The seminar included detailed explanations and demonstrations of various graphical representation techniques:
● Pie Diagrams: Demonstrating proportions and percentages within a dataset.
● Bar Diagrams: Comparing different groups or categories within a dataset.
● Frequency Polygons: Showing the distribution of data points across intervals.
● Frequency Curves: Smoothing out the data points to show trends.
● Scatter Plots: Displaying relationships between two variables.
Dr. Sajan and Dr. Sreevidya provided step-by-step guides on creating these visualizations using tools like Excel and R, emphasizing the importance of visual representation in making data comprehensible and accessible.
1. Interactive Q&A Session: Both resource persons engaged in an interactive Q&A session with the students. The students raised questions related to their specific areas of interest and received detailed explanations and guidance from the experts.
2. Hands-On Workshop: A hands-on workshop followed the theoretical sessions, allowing participants to apply the concepts learned. Under the guidance of Dr. Sajan and Dr. Sreevidya, the students worked on sample datasets to create their own data visualizations. This practical experience reinforced the seminar's learning objectives.
3. Valedictory Ceremony: The seminar concluded with a valedictory ceremony where the students reflected on the sessions. The students extended heartfelt thanks to the resource persons for making the seminar a success.
Conclusion
The seminar on "Statistics to Visualize Data for Education" was a resounding success, providing valuable insights into the application of basic statistical methods and data visualization in education. The knowledge and skills gained by the students will undoubtedly contribute to their professional development and enhance their ability to analyze and present educational data effectively. NSS Training College Ottapalam remains committed to organizing such enriching events in the future to promote continuous learning and excellence in education.


